
Page 121 - ICD AR21 EN
P. 121
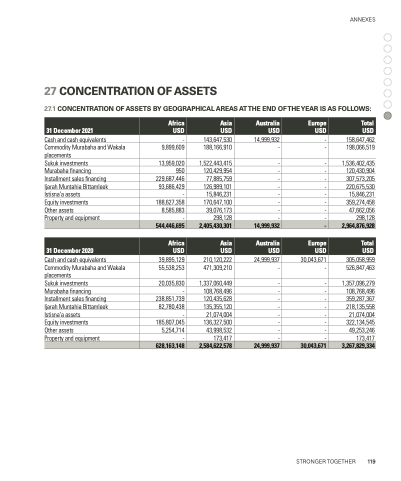
                                27 CONCENTRATION OF ASSETS
27.1 CONCENTRATION OF ASSETS BY GEOGRAPHICAL AREAS AT THE END OF THE YEAR IS AS FOLLOWS:
Cash and cash equivalents Commodity Murabaha and Wakala placements
Sukuk investments
Murabaha financing
Installment sales financing
Ijarah Muntahia Bittamleek Istisna’a assets
Equity investments
Other assets
Property and equipment
Cash and cash equivalents Commodity Murabaha and Wakala placements
Sukuk investments
Murabaha financing
Installment sales financing
Ijarah Muntahia Bittamleek Istisna’a assets
Equity investments
Other assets
Property and equipment
-
13,959,020 950 229,687,446 93,686,429 - 188,627,358 8,585,883 -
39,895,129
20,035,830 - 238,851,739 82,780,438 - 185,807,045 5,254,714 -
143,647,530       14,999,932 -       158,647,462 198,066,519
ANNEXES
 31 December 2021
    Africa USD
   Asia USD
  Australia USD
    Europe USD
  Total USD
    9,899,609
 188,166,910
 -
  -
   1,522,443,415 120,429,954 77,885,759 126,989,101 15,846,231 170,647,100 39,076,173 298,128
- - - - - - - - - - - - - - - -
1,536,402,435 120,430,904 307,573,205 220,675,530
15,846,231 359,274,458 47,662,056 298,128
                        544,446,695
  2,405,430,301
  14,999,932
  -
  2,964,876,928
   31 December 2020
    Africa USD
   Asia USD
  Australia USD
    Europe USD
  Total USD
  210,120,222       24,999,937 30,043,671       305,058,959 526,847,463
  55,538,253
 471,309,210
 -
  -
   1,337,060,449 108,768,496 120,435,628 135,355,120
21,074,004 136,327,500 43,998,532 173,417
- - - - - - - - - - - - - - - -
1,357,096,279 108,768,496 359,287,367 218,135,558
21,074,004 322,134,545 49,253,246 173,417
                        628,163,148
  2,584,622,578
  24,999,937
  30,043,671
  3,267,829,334
  STRONGER TOGETHER 119
