
Page 75 - ICD AR21 EN
P. 75
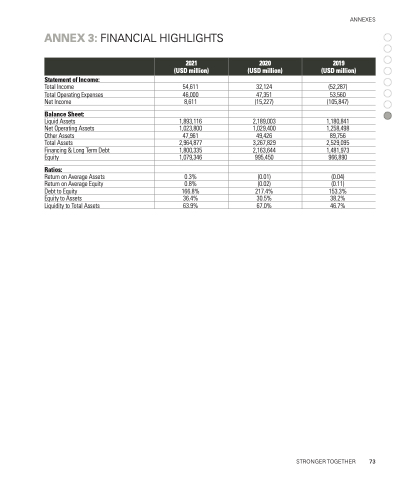
                                ANNEX 3: FINANCIAL HIGHLIGHTS
ANNEXES
   2021 (USD million)
  2020 (USD million)
  2019 (USD million)
  Statement of Income:
Total Income
Total Operating Expenses Net Income
Balance Sheet:
Liquid Assets
Net Operating Assets
Other Assets
Total Assets
Financing & Long Term Debt Equity
Ratios:
Return on Average Assets Return on Average Equity Debt to Equity
Equity to Assets
Liquidity to Total Assets
54,611 46,000 8,611
1,893,116 1,023,800 47,961 2,964,877 1,800,335 1,079,346
0.3%
0.8% 166.8% 36.4% 63.9%
32,124
47,351 (15,227)
2,189,003 1,029,400 49,426 3,267,829 2,163,644 995,450
(0.01)
(0.02) 217.4% 30.5% 67.0%
(52,287) 53,560 (105,847)
1,180,841 1,258,498 89,756 2,529,095 1,481,973 966,890
(0.04)
(0.11) 153.3% 38.2% 46.7%
                   STRONGER TOGETHER 73
